PyData NYC: Making Static and Interactive Viz Using Matplotlib
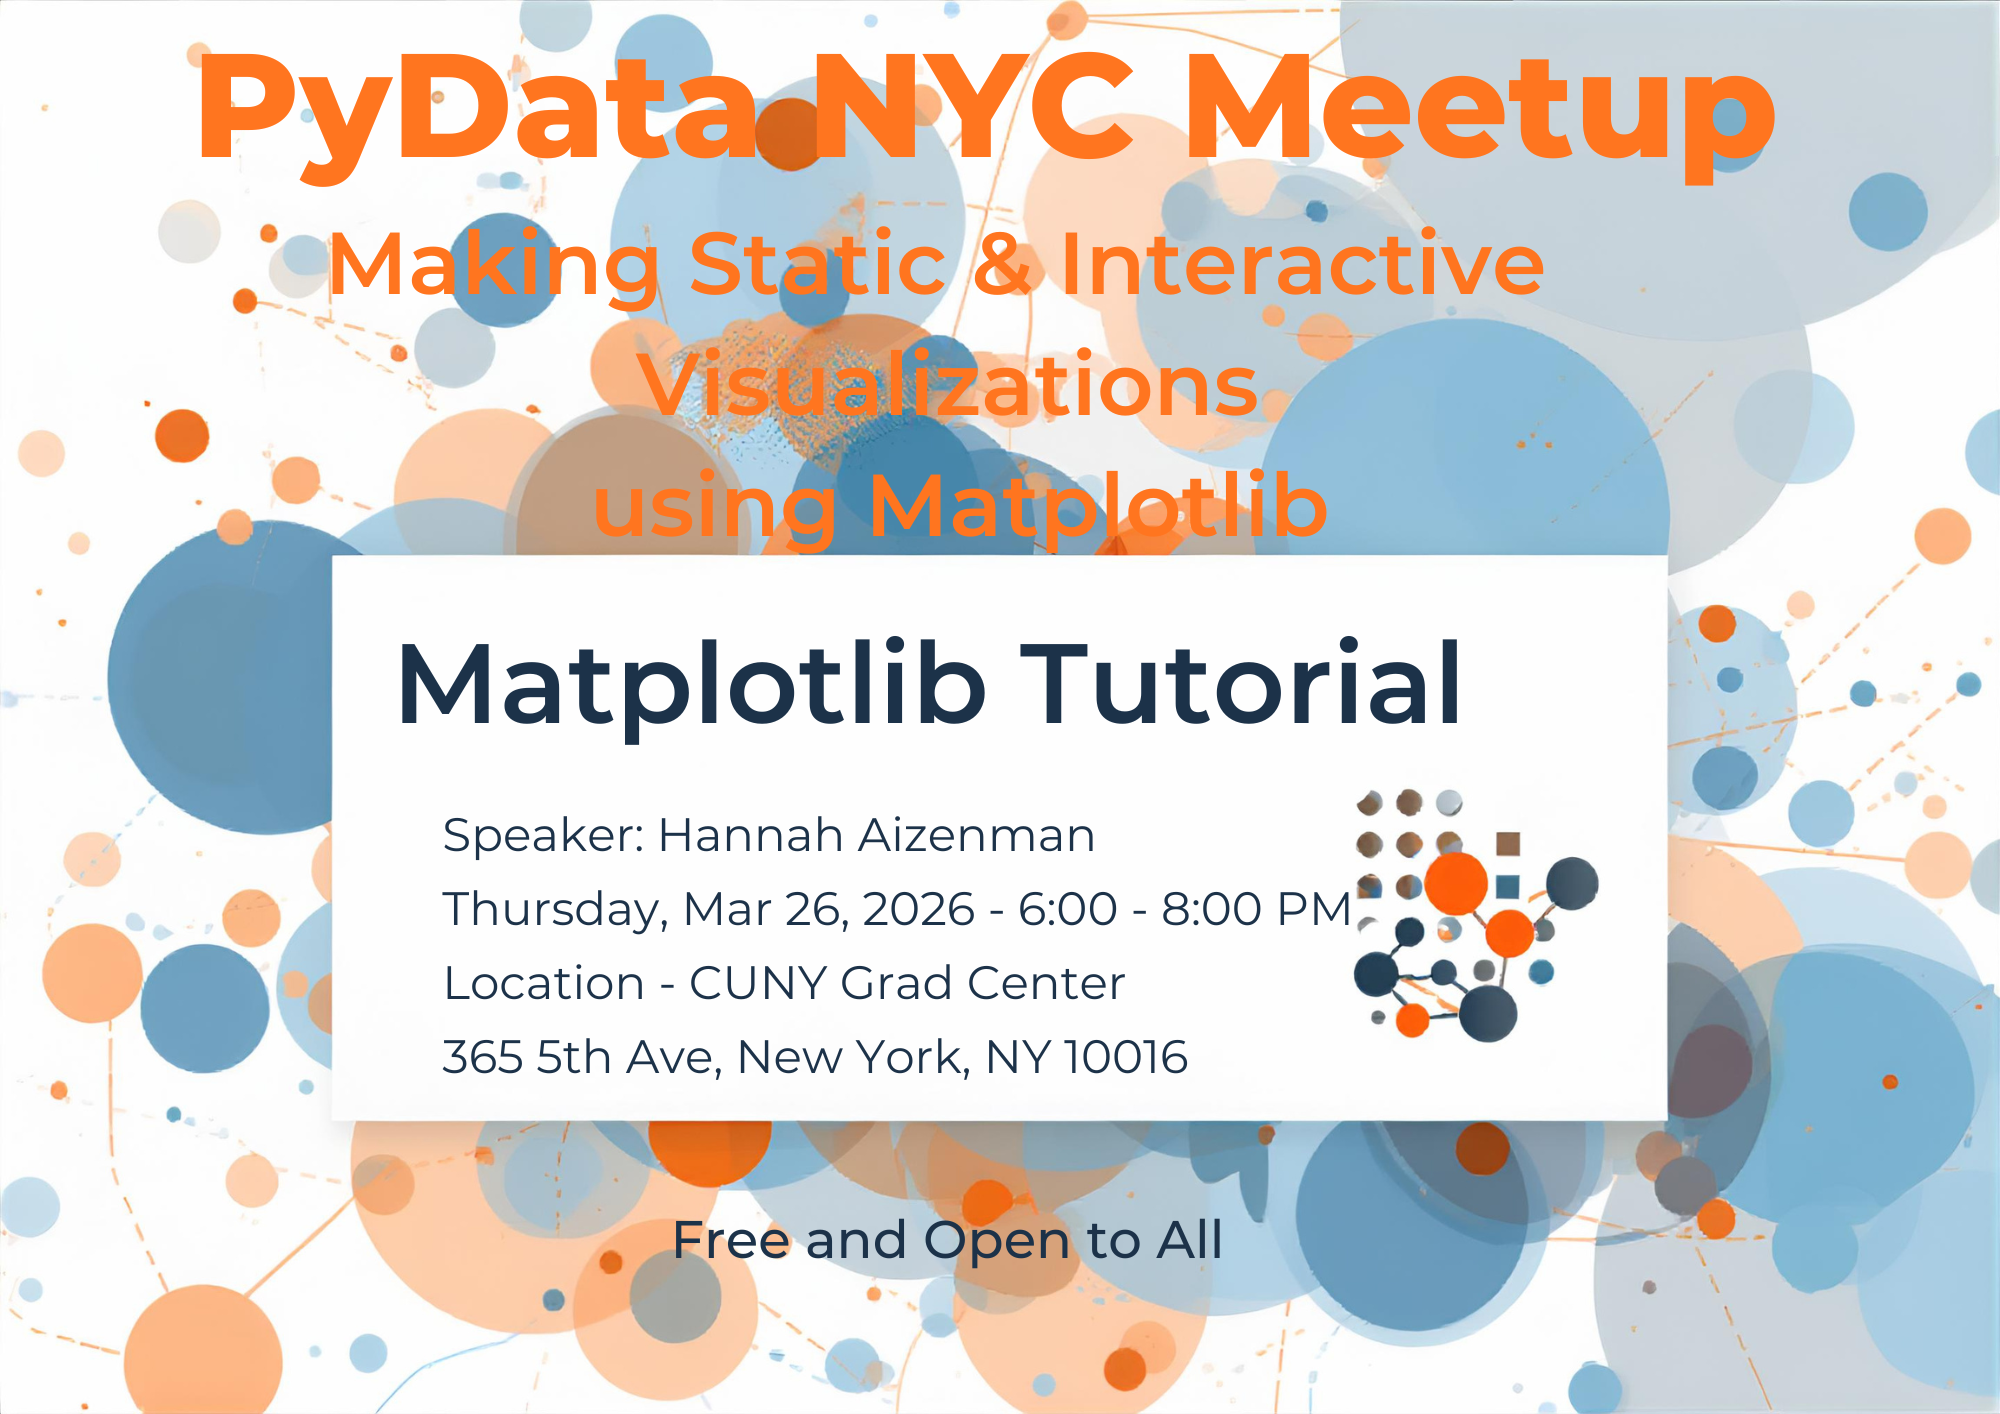
In this workshop with PyData NYC, we will explore 311 dataset, starting with exploratory charts (including maps), maybe creating a linked animation, and concluding with a simple interactive visualization. In doing so, we will unpack some of the fundamental concepts that underlie the architecture of Matplotlib, hopefully providing attendees with the foundation for creating effective visualizations using Matplotlib. And the vocabulary to make more effective use of AI tools. Matplotlib is a big library, and it can be difficult to know where to start.
This demo-tutorial is a guided tour through many of the essential features and concepts of Matplotlib so you can get started making publication-quality, animated, and interactive figures. We will be using the 311 dataset as a case study.
This event will be held at the CUNY Graduate Center (365 5th Avenue) in Manhattan. Register here.